---
title: "R Course"
subtitle: "Heatmaps"
author: "Karla Fejfarová"
date: "2018/09/20"
output:
xaringan::moon_reader:
css: ["pres.css", "default", "default-fonts"]
lib_dir: libs
seal: false
nature:
highlightStyle: github
highlightLines: true
countIncrementalSlides: false
---
layout: true
---
```{r setup, include=FALSE}
options(htmltools.dir.version = FALSE)
```
# What is a heatmap?
--
.pull-left[
```{r mat1, warning=FALSE, echo=FALSE, message=FALSE}
library(knitr)
library(kableExtra)
library(tidyverse)
set.seed(42)
mat <- matrix(rnorm(21), 7, 3,
dimnames = list(LETTERS[1:7], 1:3))
kable(mat, format = "html")
```
### Can you spot the lowest value?
]
--
.pull-right[
```{r mat2, warning=FALSE, echo=FALSE, message=FALSE}
library(pheatmap)
pheatmap(mat, cluster_rows = FALSE, cluster_cols = FALSE, scale = "none",
fontsize = 14)
```
]
---
## What is a heatmap?
---
## What is a heatmap?
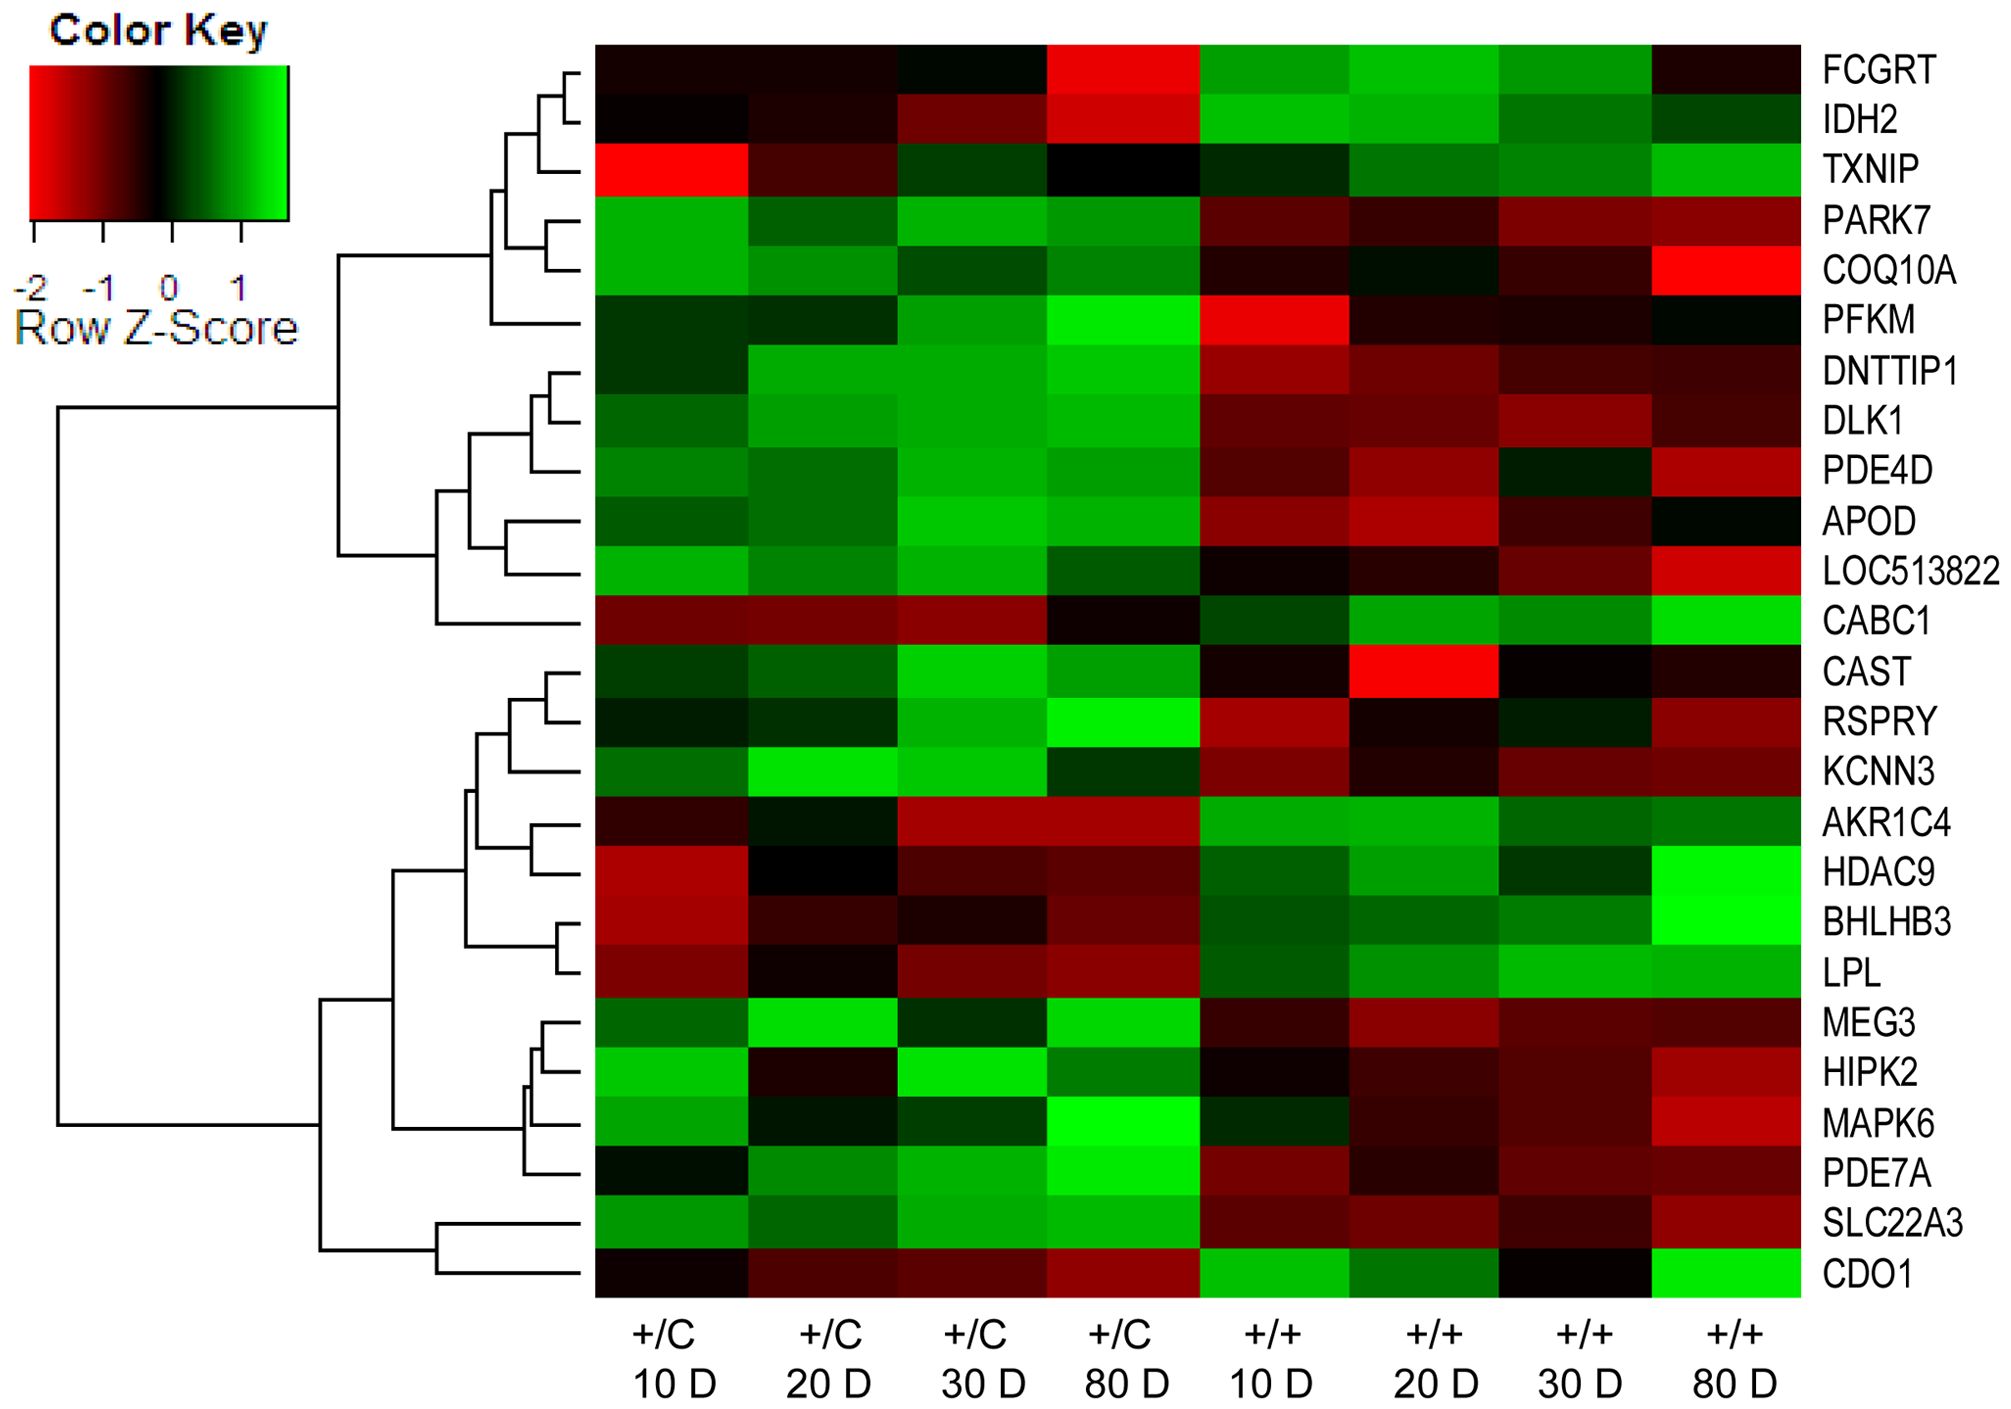 image source: [https://doi.org/10.1371/journal.pone.0007399.g004](https://doi.org/10.1371/journal.pone.0007399.g004)
---
## Data
```{r, warning=FALSE, echo=FALSE, message=FALSE}
ritter <- as.data.frame(read_csv("./data/ritter.csv"))
kable(head(ritter, n = 10), "html") %>%
kable_styling(bootstrap_options = c("striped", "hover", "condensed"), font_size = 10)
```
---
## Data
.pull-left[
```{r, warning=FALSE, echo=FALSE, message=FALSE}
rit_m <- ritter[3:13]
rownames(rit_m) <- ritter$Chocolate
pheatmap(rit_m, cluster_rows = FALSE, cluster_cols = FALSE, scale = "none",
fontsize = 12, fontsize_col = 7)
```
]
---
## Data
.pull-left[
```{r box, warning=FALSE, echo=FALSE, message=FALSE}
ritter %>%
gather(-c('Number', 'Chocolate', 'Cocoa', 'Type'),
key = "name", value = "rank") %>%
mutate(Number = as.factor(Number)) %>%
ggplot() +
geom_boxplot(aes(x=Number, y=rank))
```
]
.pull-right[
### Scale?
- The differences between the features outweighs differences between samples
Z-score normalization
$$z_i=\frac{x_i -\mu}{\sigma}$$
- What are you interested in? [(Link)](http://www.opiniomics.org/you-probably-dont-understand-heatmaps/)
]
---
## Data
.pull-left[
```{r, warning=FALSE, echo=FALSE, message=FALSE}
pheatmap(rit_m, cluster_rows = FALSE, cluster_cols = FALSE,
scale = "row",
fontsize = 12, fontsize_col = 7)
```
]
.pull-right[
### Scale?
- The differences between the features outweighs differences between samples
Z-score normalization
$$z_i=\frac{x_i -\mu}{\sigma}$$
- What are you interested in? [(Link)](http://www.opiniomics.org/you-probably-dont-understand-heatmaps/)
]
---
## Data
.pull-left[
```{r, warning=FALSE, echo=FALSE, message=FALSE}
pheatmap(rit_m, cluster_rows = FALSE, cluster_cols = FALSE,
fontsize = 12, fontsize_col = 7,
scale = "none")
```
]
--
.pull-right[
### Can you see groups?
]
---
## Heatmap clustering
.pull-left[
```{r, warning=FALSE, echo=FALSE, message=FALSE}
pheatmap(rit_m, scale = "none",
fontsize = 10, fontsize_col = 7)
```
]
.pull-right[
How does it work: [(Wiki)](https://en.wikipedia.org/wiki/Hierarchical_clustering#Agglomerative_clustering_example)
]
---
## Plotting heatmaps in R
- [heatmap](https://stat.ethz.ch/R-manual/R-devel/library/stats/html/heatmap.html)
- heatmap.2 ([gplots package](https://cran.r-project.org/web/packages/gplots/index.html))
- [pheatmap](https://cran.r-project.org/web/packages/pheatmap/index.html)
- [ComplexHeatmap](https://github.com/jokergoo/ComplexHeatmap)
- [d3heatmap](https://cran.r-project.org/package=d3heatmap)
- [heatmaply](https://cran.r-project.org/web/packages/heatmaply/index.html)
and many more.
image source: [https://doi.org/10.1371/journal.pone.0007399.g004](https://doi.org/10.1371/journal.pone.0007399.g004)
---
## Data
```{r, warning=FALSE, echo=FALSE, message=FALSE}
ritter <- as.data.frame(read_csv("./data/ritter.csv"))
kable(head(ritter, n = 10), "html") %>%
kable_styling(bootstrap_options = c("striped", "hover", "condensed"), font_size = 10)
```
---
## Data
.pull-left[
```{r, warning=FALSE, echo=FALSE, message=FALSE}
rit_m <- ritter[3:13]
rownames(rit_m) <- ritter$Chocolate
pheatmap(rit_m, cluster_rows = FALSE, cluster_cols = FALSE, scale = "none",
fontsize = 12, fontsize_col = 7)
```
]
---
## Data
.pull-left[
```{r box, warning=FALSE, echo=FALSE, message=FALSE}
ritter %>%
gather(-c('Number', 'Chocolate', 'Cocoa', 'Type'),
key = "name", value = "rank") %>%
mutate(Number = as.factor(Number)) %>%
ggplot() +
geom_boxplot(aes(x=Number, y=rank))
```
]
.pull-right[
### Scale?
- The differences between the features outweighs differences between samples
Z-score normalization
$$z_i=\frac{x_i -\mu}{\sigma}$$
- What are you interested in? [(Link)](http://www.opiniomics.org/you-probably-dont-understand-heatmaps/)
]
---
## Data
.pull-left[
```{r, warning=FALSE, echo=FALSE, message=FALSE}
pheatmap(rit_m, cluster_rows = FALSE, cluster_cols = FALSE,
scale = "row",
fontsize = 12, fontsize_col = 7)
```
]
.pull-right[
### Scale?
- The differences between the features outweighs differences between samples
Z-score normalization
$$z_i=\frac{x_i -\mu}{\sigma}$$
- What are you interested in? [(Link)](http://www.opiniomics.org/you-probably-dont-understand-heatmaps/)
]
---
## Data
.pull-left[
```{r, warning=FALSE, echo=FALSE, message=FALSE}
pheatmap(rit_m, cluster_rows = FALSE, cluster_cols = FALSE,
fontsize = 12, fontsize_col = 7,
scale = "none")
```
]
--
.pull-right[
### Can you see groups?
]
---
## Heatmap clustering
.pull-left[
```{r, warning=FALSE, echo=FALSE, message=FALSE}
pheatmap(rit_m, scale = "none",
fontsize = 10, fontsize_col = 7)
```
]
.pull-right[
How does it work: [(Wiki)](https://en.wikipedia.org/wiki/Hierarchical_clustering#Agglomerative_clustering_example)
]
---
## Plotting heatmaps in R
- [heatmap](https://stat.ethz.ch/R-manual/R-devel/library/stats/html/heatmap.html)
- heatmap.2 ([gplots package](https://cran.r-project.org/web/packages/gplots/index.html))
- [pheatmap](https://cran.r-project.org/web/packages/pheatmap/index.html)
- [ComplexHeatmap](https://github.com/jokergoo/ComplexHeatmap)
- [d3heatmap](https://cran.r-project.org/package=d3heatmap)
- [heatmaply](https://cran.r-project.org/web/packages/heatmaply/index.html)
and many more.